
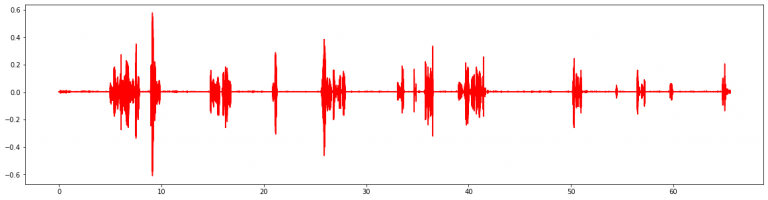
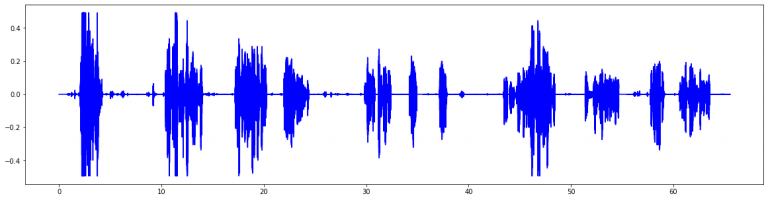
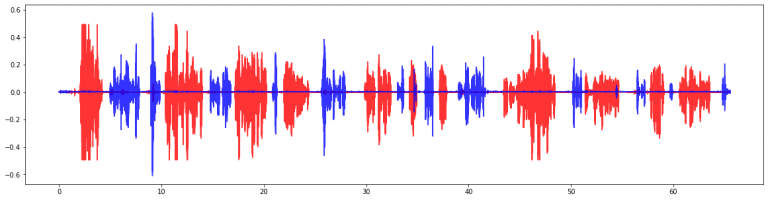
下面是serviceData与clientData可视化的代码与波形图,为了更直观的显示两个声道的信号,这里在可视化的时候,调整了不透明度。
import matplotlib.pyplot as plt
import numpy as np

plt.figure()

l=sig.shape[0]
x = [i/8000 for i in range(l)]
plt.plot(x, serviceData, c='r', alpha=0.8)
plt.plot(x, clientData, c='b', alpha=0.8)
plt.show()

Pingback: Python分离立体声wav压缩文件的左右声道 – 最好的小安排